Analyze Sales Activities & Clients
See What Your Sales People Are Doing
How many emails they sent, calls they made, leads they found etc.

Get Real Time Visibility in Sales
Saves several hours wasted in creating reports & waiting for reports.
Any report you need will be just a click away.

Sales Dashboard
Track overall sales performance and meet your targetsTeam Dashboard
Rank the performance of individuals against each otherCreate Reports While in Meeting
And take decisions based on facts, not guesses

Get the Metrics You Need
Sales, deal sizes, close rate, activities, comparative
performance, etc.
For Any Time Frame
Last 6 months, Last 30 days, Last Month,
Last 2 quarters etc
Awesome Visualizations
Area Chart
Pie Chart
Line Chart
Donut Chart
Pivot Table
See How Easy
You can choose from various types of charts / tables. You can also change the chart in 1 click.
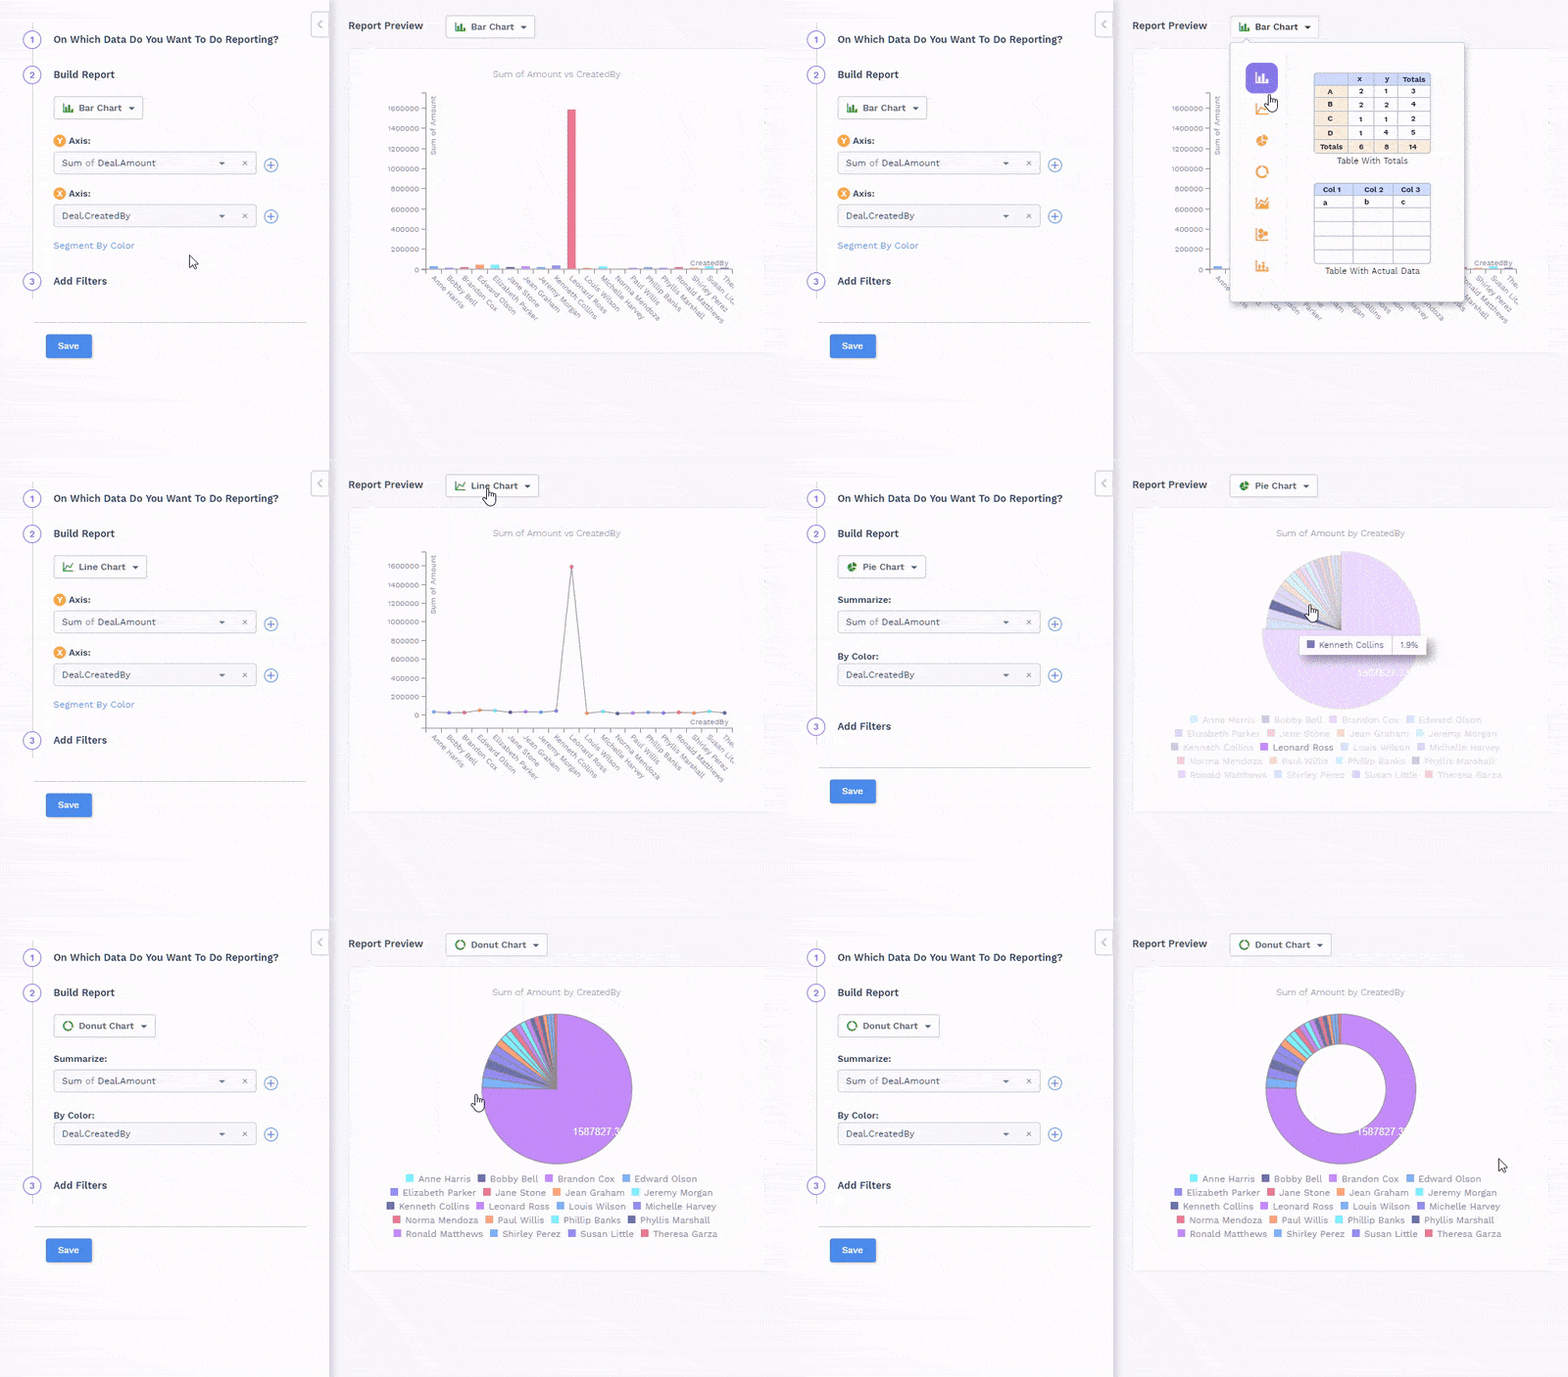
You can do reporting on custom fields / tables, just like standard fields / tables.

You can analyze almost anything like
- Last 3 Quarters Sales
- Deals lost in last 12 mothns by sales person
- Average number of emails sent
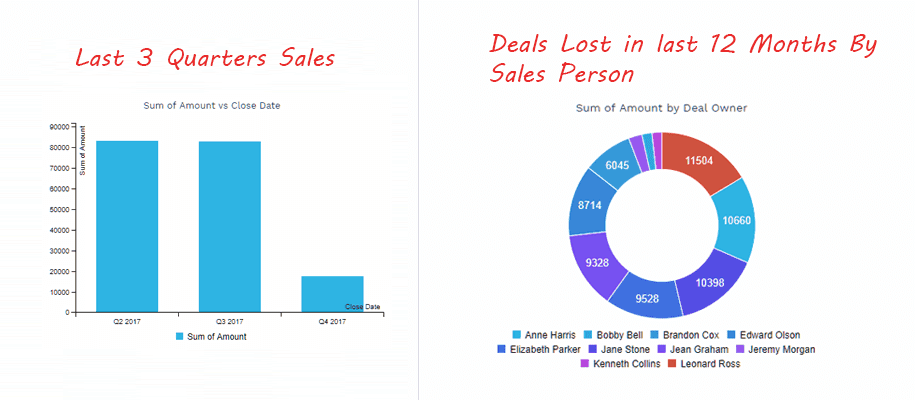
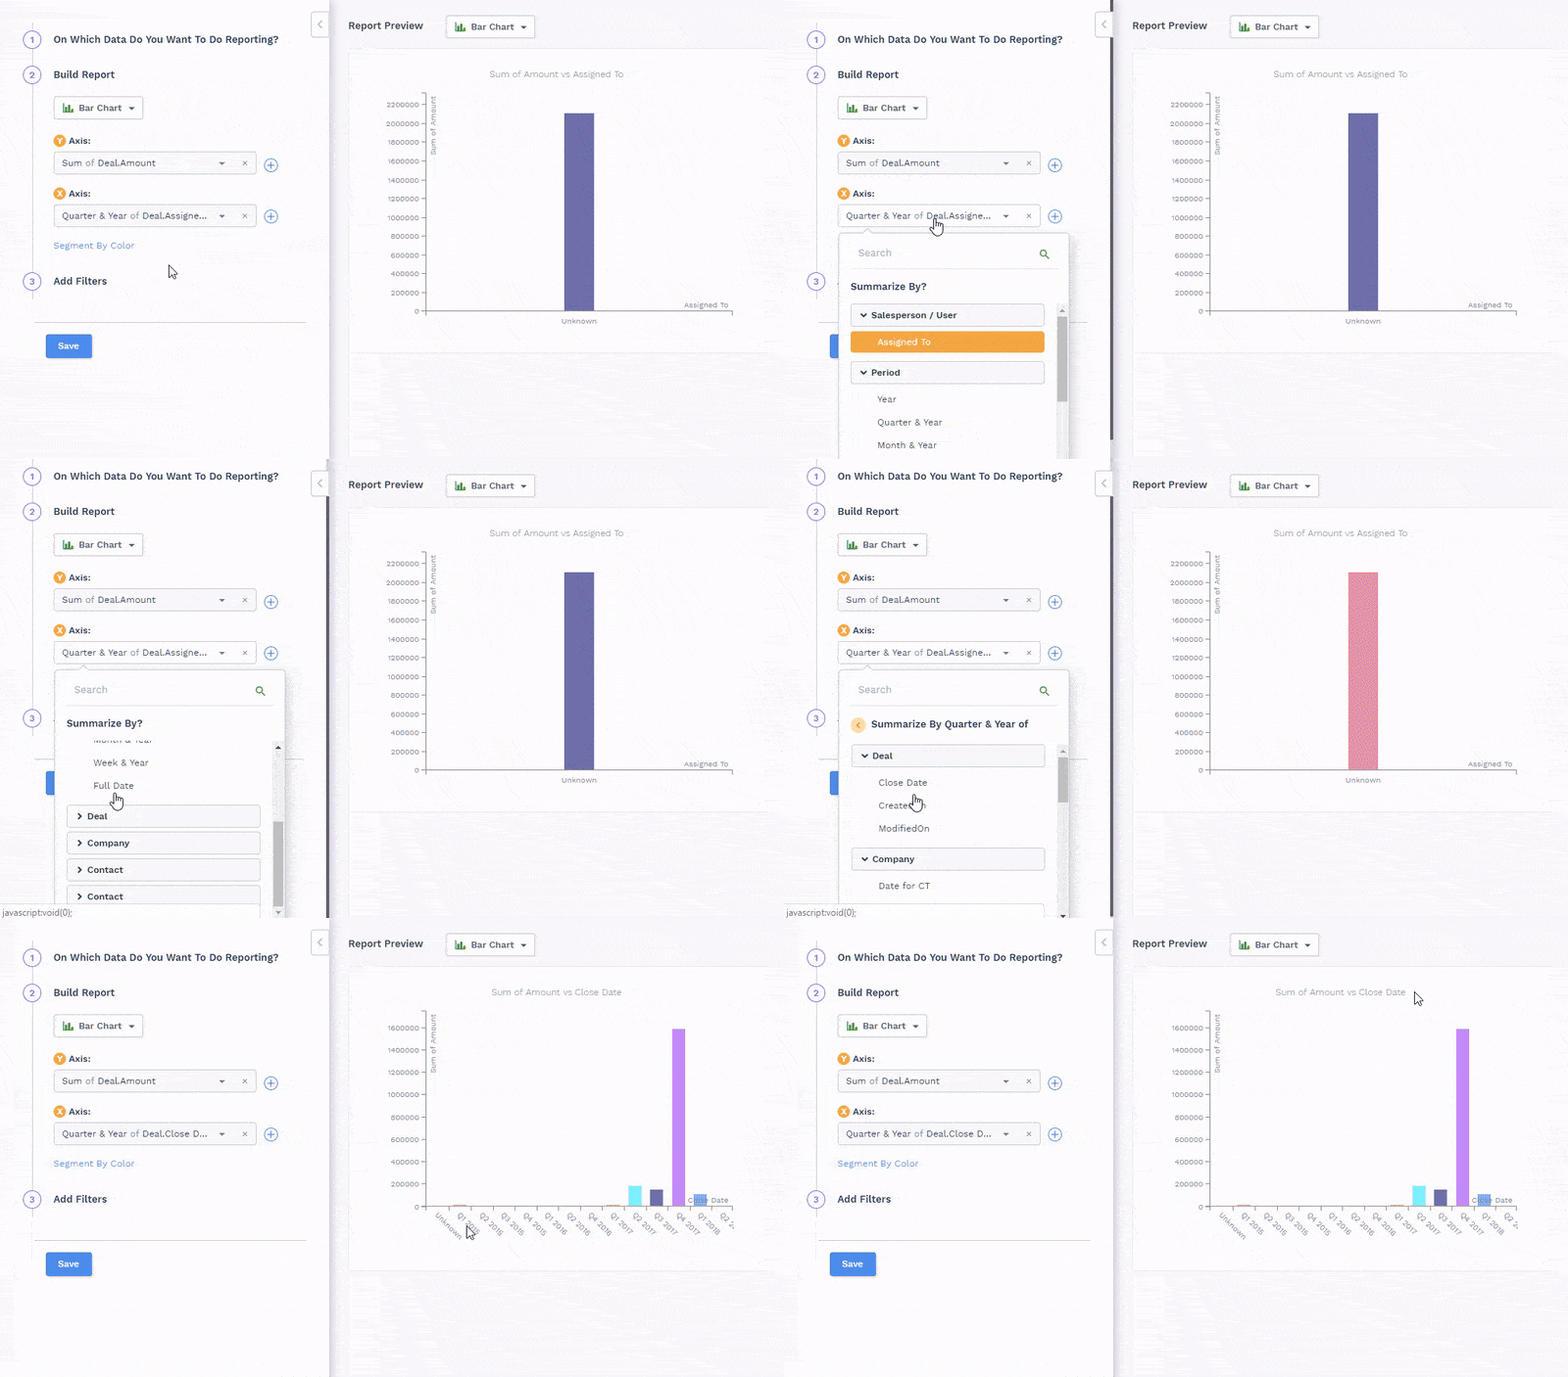
You can easily add filters like last 3 months, last 7 days etc. Whenever you will see report, system will automatically calculate period and show the report you need.
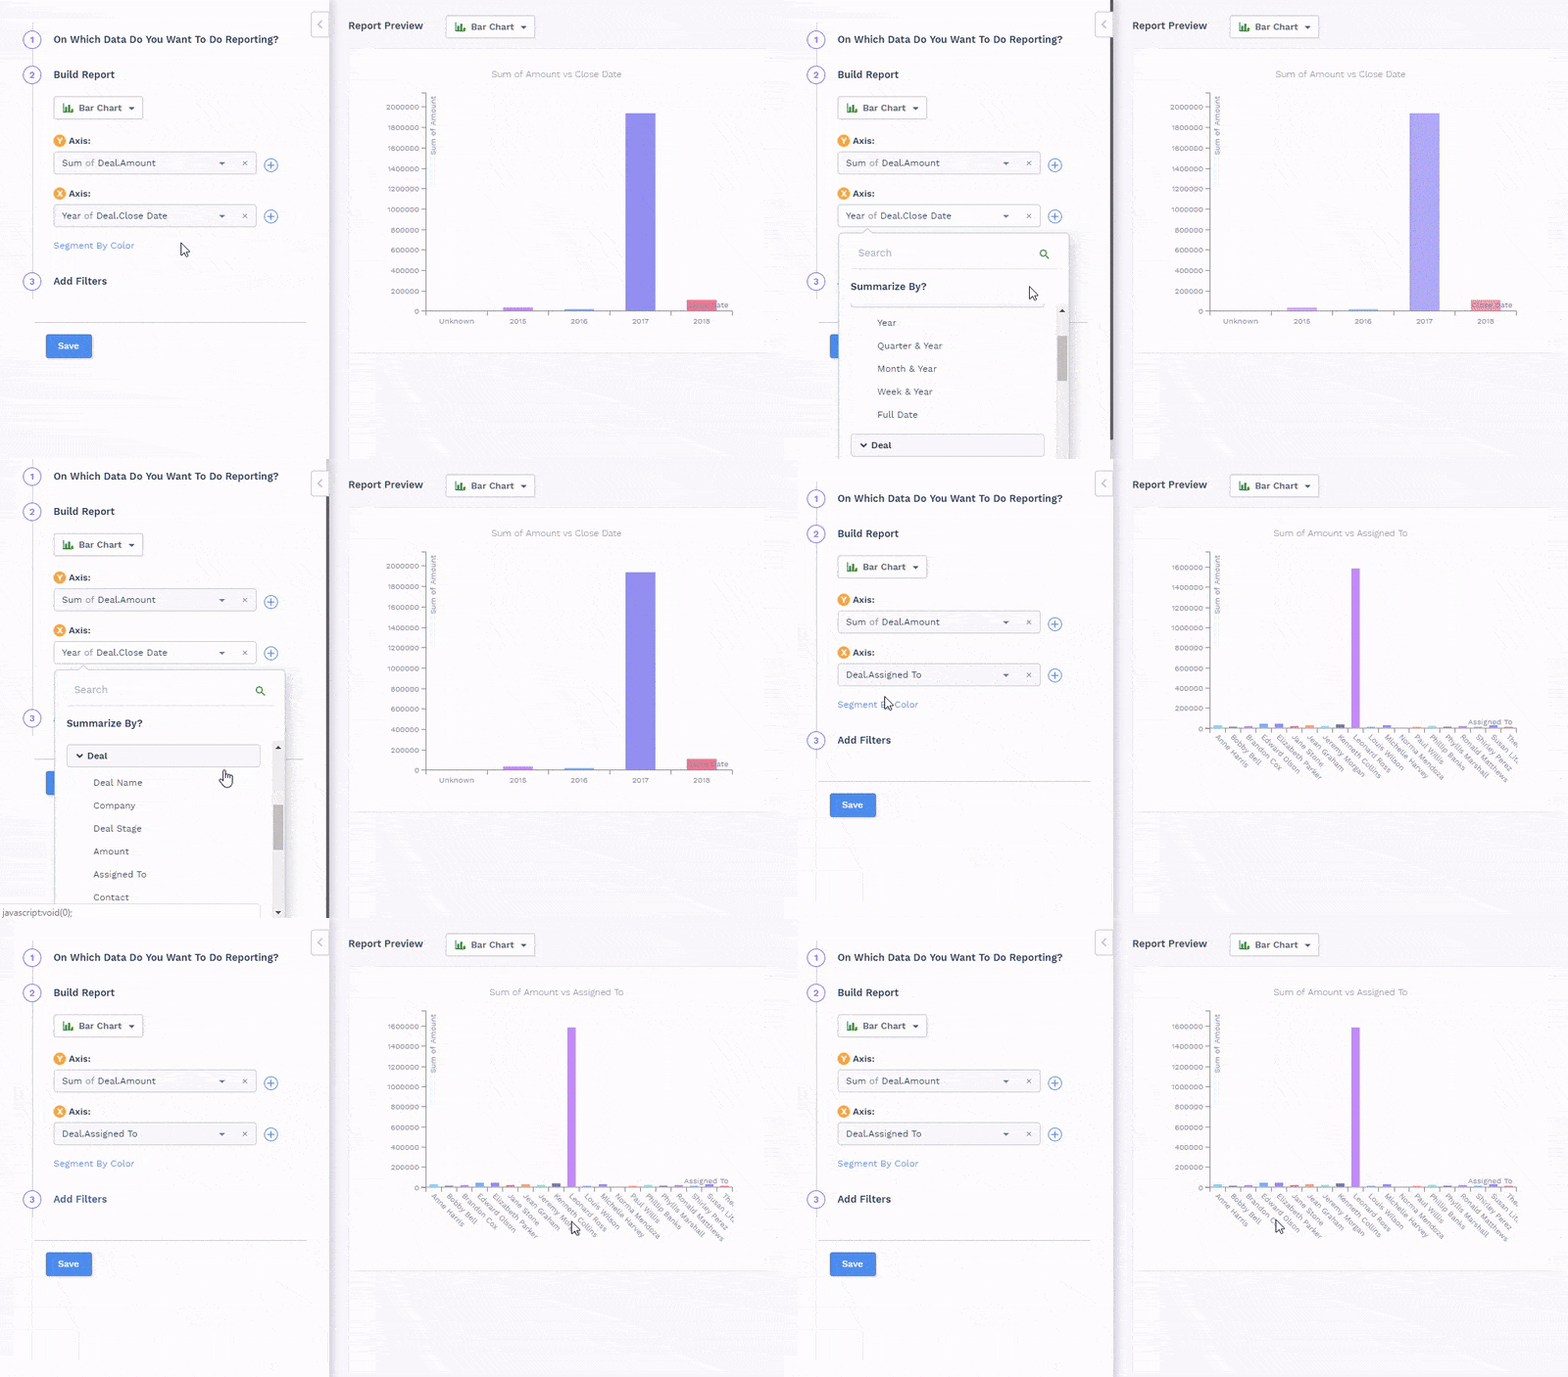
You can also see reports by sales person
You can easily restrict your report to specific records, period or users by adding filters. Just select field and it’s condition. You can also add multiple filters.
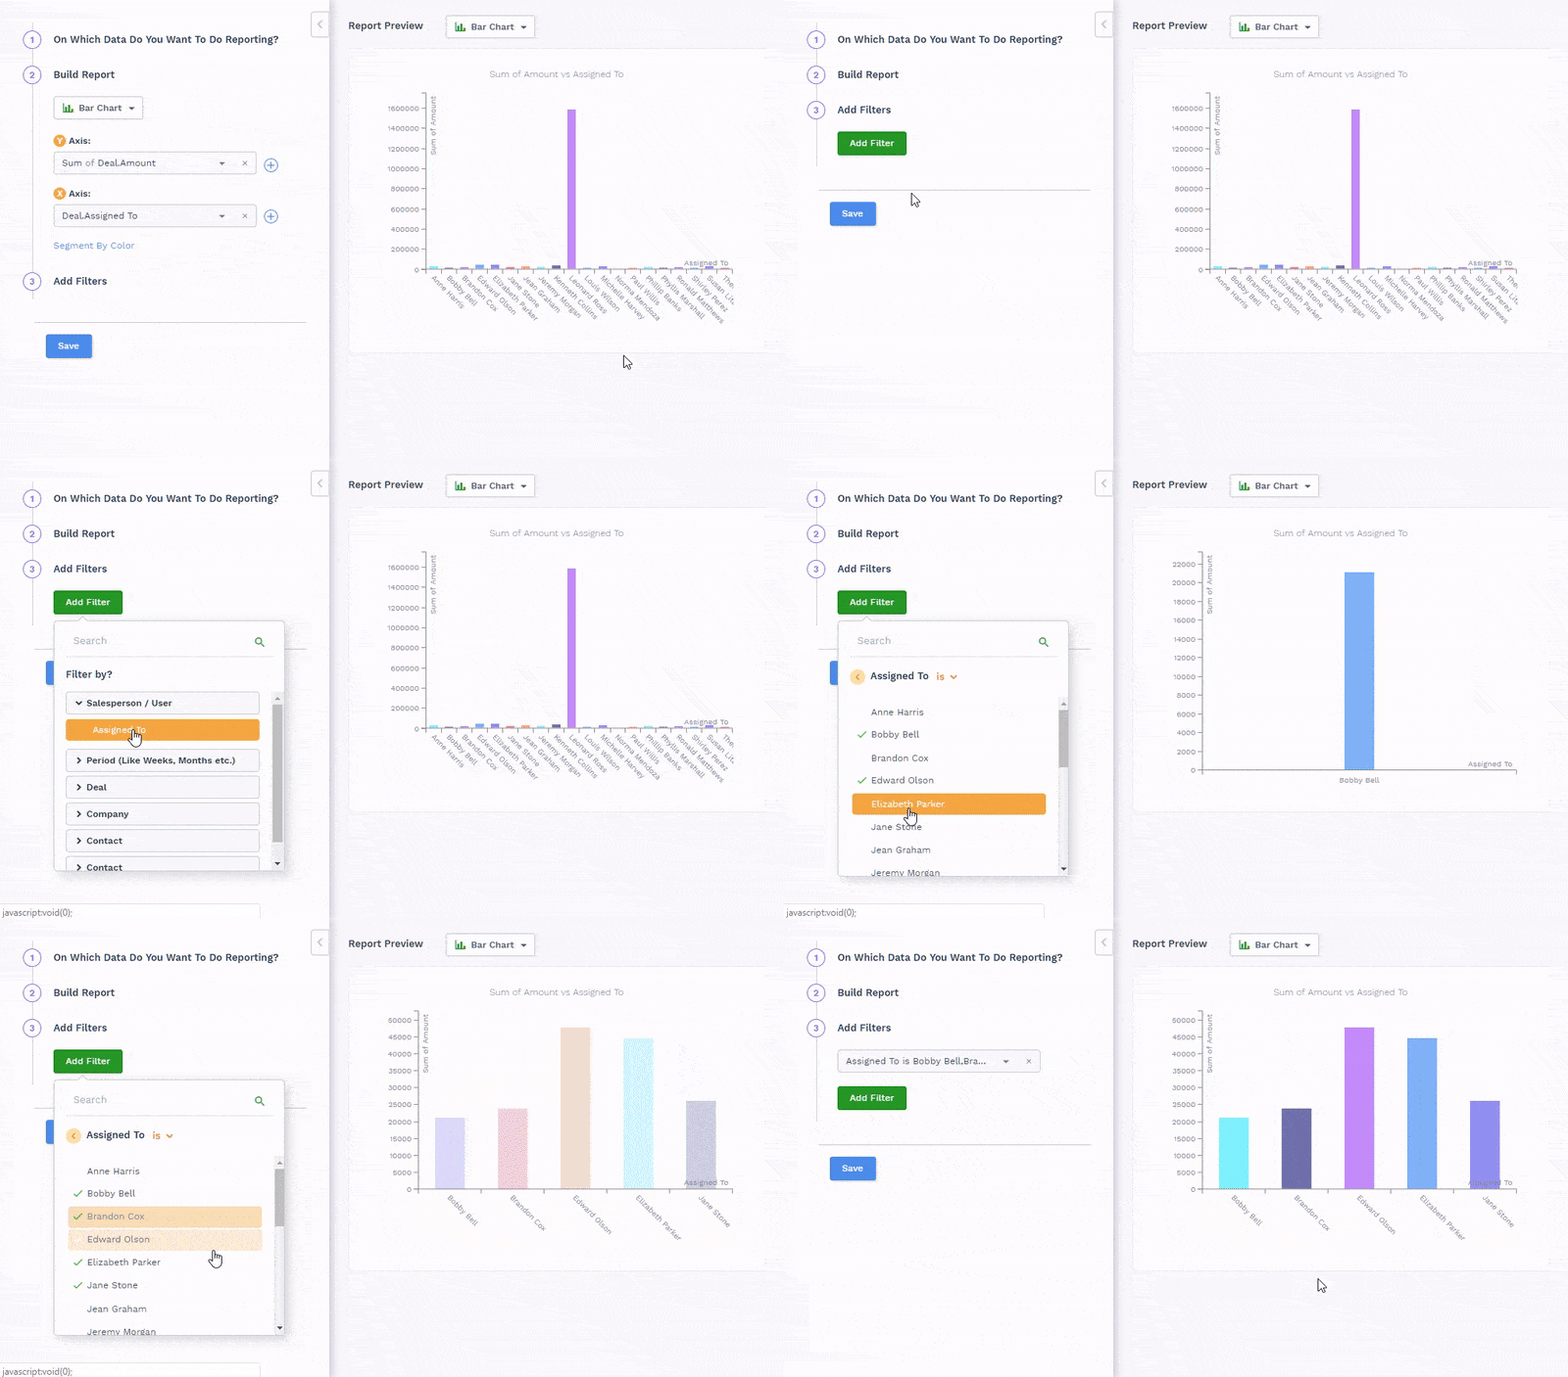


 Bar Chart


