
Different types of Tabular reports:


How to create tabular report
-
Choose table
First choose Table (type of records) on which you want to do reporting. By default ‘Deal’ is chosen.
In some cases, it is not obvious which table should you choose for reporting. Below table will help in such cases.
Need Table Reporting on Email / Calls / Tasks etc Activity Change in values of a field like Deal Stages (Tracking changes should be enabled for that field) y Field Changes Sale / Purchase of Products Sales Order Product / Purchase Order Product -
Choose Tabular report
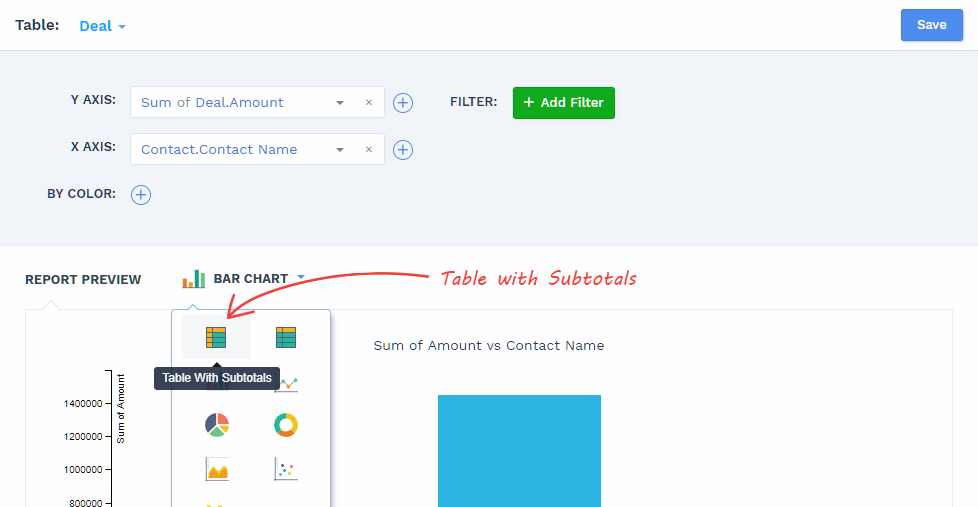
In most cases, when creating Tabular report, you want to see totals. So you must choose Report – Table with sub totals
![Sales Analytics - table with subotals]()
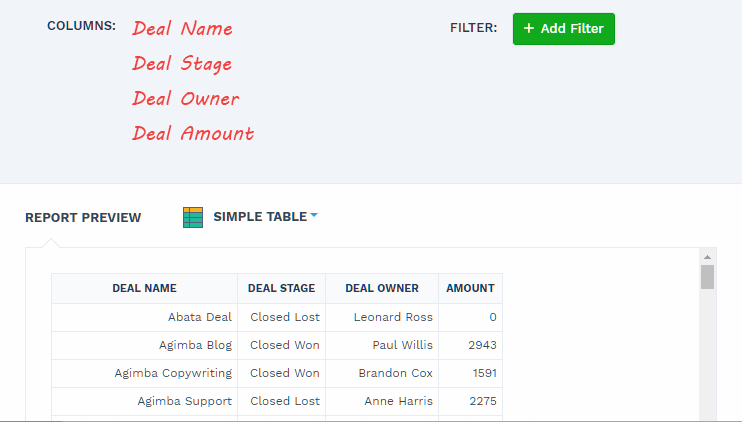
Occasionally, you might want to see actual data in report. In that case choose Table with actual values.
![Sales Analytics - table with actual values]()
-
Choose Summarize
What number do you want? Like
- Sum of Deal amount
- Count of Contacts Created
- Average number of emails sent
- Count of unique values for a field
If nothing is chosen, click in front of Summarize. Else click existing value to change it. Choose whether you want sum / count etc. Then choose the field for which total should be calculated. You can also summarise more than one fields by clicking .
-
Choose Column
You might want to see the total by sales person / user, by date range (by week / month / quarter / year) or by any other field. Select that field on Column. E.g. to see sales by country, select country on Column. A column will be shown for each country, along with its total.
How do i?
Note: Descriptions in below links mention X Axis / Y Axis. In Tabular reports, those options are available in rows as well as columns.See Weekly / Monthly / Quarterly / Yearly Reports
See report by Sales person / User
Use fields of associated records (different table) -
Choose Row
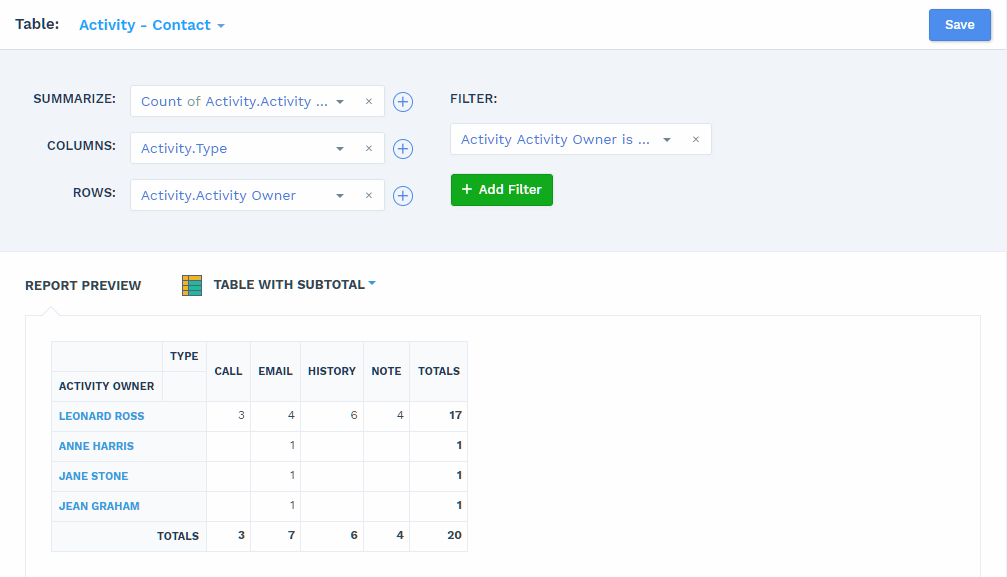
![Sales Analytics - choose row]()
To see a table of X by Y, like above, add the second field to row. So you will see totals for different combinations of X & Y. In above table, Column contains Activity Type (Email, Call etc.) and Row contains Activity Owner (user). So you see activities by each user – how many emails, calls etc.
-
Filter Records
You can easily restrict your report to specific records, period or users by adding filters. Just select field and it’s condition. You can also add multiple filters. Learn filters in more detail here.

Multiple Rows / Columns / Summaries
If you want to see further breakup by sub category/ segments of selected row / column, click on ‘+’ and select the sub category field.

Similarly, you can also see multiple totals.
