How to create new chart
-
Choose Table
First choose Table (type of records) on which you want to do reporting. By default ‘Deal’ is chosen.
In some cases, it is not obvious which table should you choose for reporting. Below table will help in such cases.
Need Table Reporting on Email / Calls / Tasks etc Activity Change in values of a field like Deal Stages (Tracking changes should be enabled for that field) Field Changes Sale / Purchase of Products Sales Order Product / Purchase Order Product -
Choose Y Axis
What number do you want? Like
- Sum of Deal amount
- Count of Contacts Created
- Average number of emails sent
- Count of unique values for a field
Click , in front of Y Axis. Choose whether you want sum / count etc. Then choose the field for which total should be calculated.
If you want multiple Y Axis, click on again and choose 2nd Y Axis. -
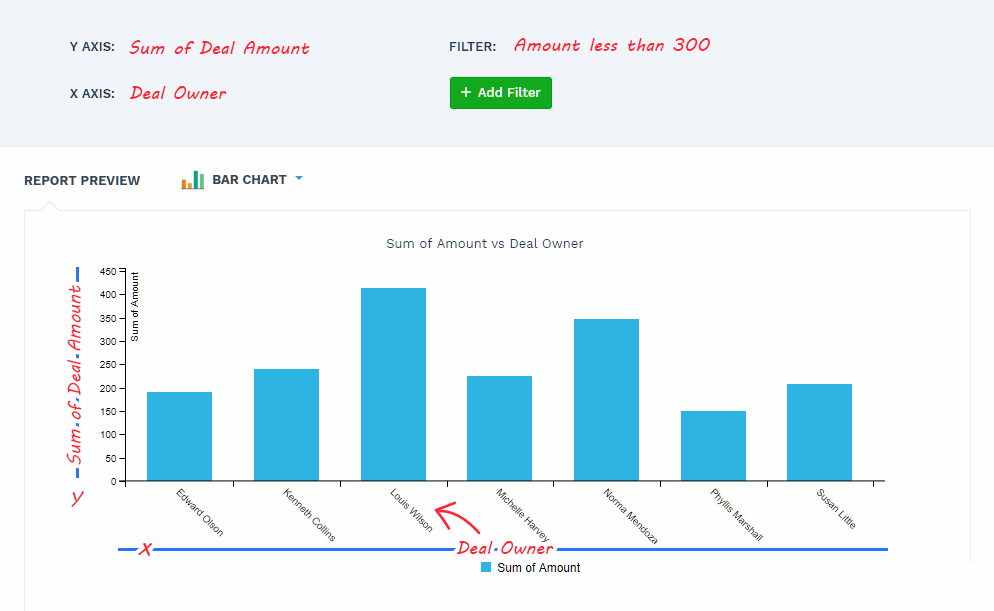
Choose X Axis
You might want to see the total by sales person / user, by date range (by week / month / quarter / year) or by any other field. Select that field on X Axis. E.g. to see sales by country, select country on X Axis.
See Weekly / Monthly / Quarterly / Yearly Reports
To see the total by date range, on X Axis, under Period, select the type of date range – Date, Week, Month, Quarter or Year. Then select the date field.
See report by Sales person / User
Owner field (Contact owner, Deal owner etc.) represent the sales person / user to which the record is assigned. To see report by sales person/user, select the owner field on X Axis.
Using fields of associated records (different table)
Along with fields of chosen table, you can also select fields of associated tables. You can scroll down to see associated tables and their fields.
Can’t find the field you need?
If you do not see the associated table and it’s fields, chosen table might not be having a field of the other table. For example, even though Contact and Company are associated, Company does not have Contact field. Contact has Company field. So when creating report on Contact table, you can use fields of Company. But when creating report on Company, you can’t see fields of Contact (as there can be many Contacts associated with each Company). If you really need, try creating the report on the other table.
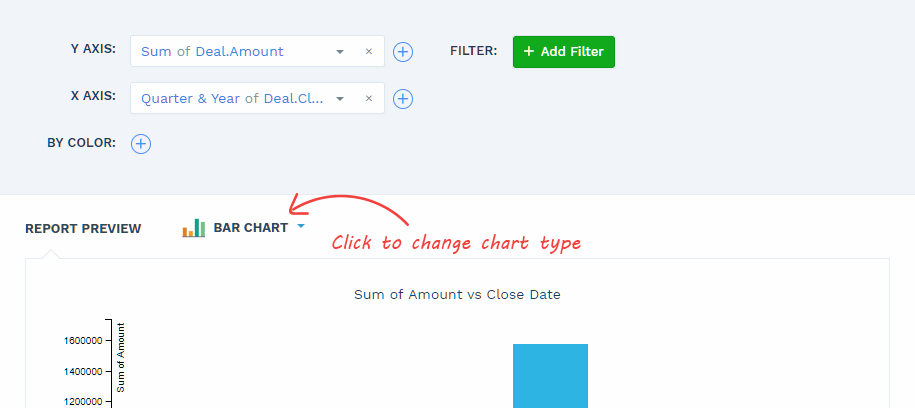
Choose Type of Chart
You can choose from various types of charts by clicking on chart type next to ‘Report preview’. Report options can change based on chart type – like Pie chart doesn’t have two axis. When you change chart type, CompanyHub smartly tries to adapt to the new chart type. If it’s not proper, you can modify the configuration. If you want to see a table instead of chart, click here.
![Sales Reporting - change chart type]()
-
Filter Records
You can easily restrict your report to specific records, period or users by adding filters. Just select field and it’s condition. You can also add multiple filters. Learn filters in more detail here.
-
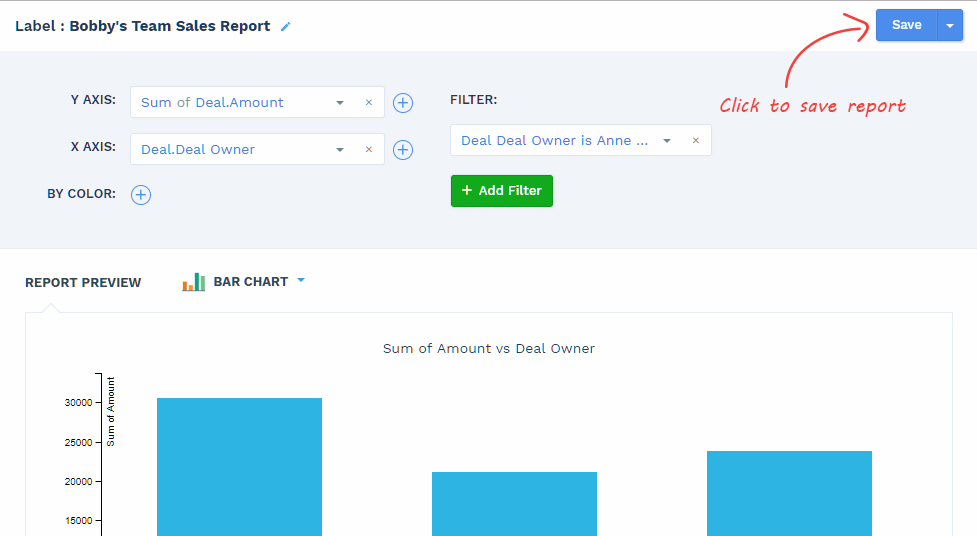
Save Report
When saving report, you can choose the name & description of the report. You must also choose the folder in which report should be saved. You should organise the reports in folders. You can also share folders with other users.
![Sales Reporting - save report]()
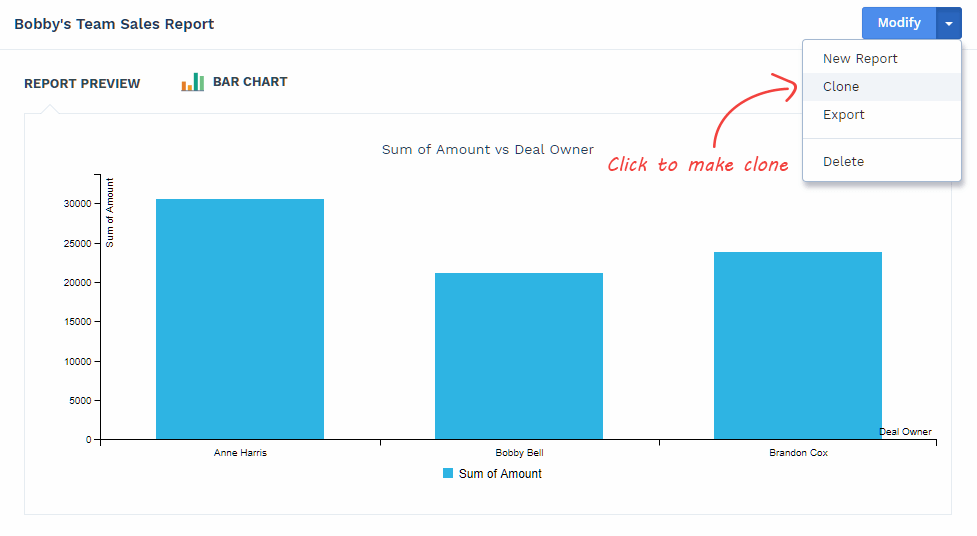
Clone Report
Easiest way to create report is to clone an existing report and modify it.
See existing reports. Find the closest report. Click ‘Clone’. New report will be created. Modify and save it.
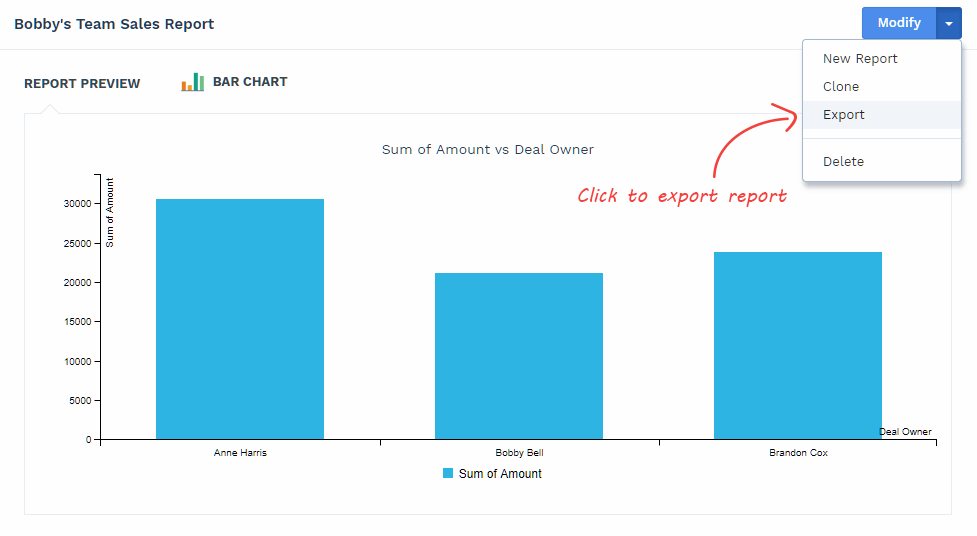
Export Report
You can export a report as CSV (can be opened in excel). Data shown in chart / table will be exported, not graphical charts.
Just click on ‘Export’. After few seconds you will get the file through email.